
Checkmate Infrastructure· Instead of UptimeRobot
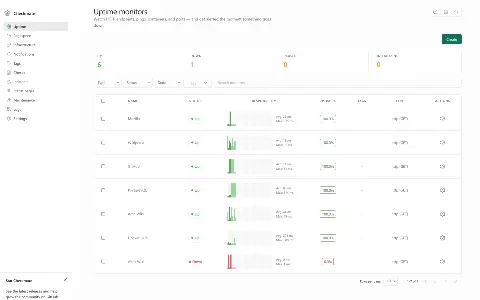
Uptime monitoring with a status page: response times, history and alerts when something is down.

Lightweight server monitoring: CPU, memory and disk over time, with alerts.
Beszel shows CPU, memory, disk and network of your servers over time and alerts you when thresholds are crossed.
Monitored machines report to the hub through a small agent — this pod is the hub.
 CPU, RAM, disk and network over time Docker containers per machine Alerts by email and webhook Tiny agent, hardly any load
Good to know before the first start. This pod is the hub. For data to appear, install the Beszel agent on every machine you want to monitor and add it in the hub.
A small agent per machine, hardly any load No price per host or metric Metrics and alerts stay in your instance| Datadog and Podless | Datadog | On Podless |
|---|---|---|
| Where the data lives | DatadogOn the provider’s servers | On PodlessIn your own instance in the EU |
| Source code | DatadogNot open to read | On PodlessOpen, you can read what runs |
| Ads and profiling | DatadogPer the provider’s terms | On PodlessNone |
| Your own domain | DatadogUsually not offered | On PodlessIncluded, certificate too |
| Getting out again | DatadogAs far as the provider allows | On PodlessSFTP, database, backups to your storage |
| If it gets shut down | DatadogYou have to move | On PodlessYou decide when you leave |
At the recommended size (0.25 cores · 0.5 GB RAM · 5 GB Storage) about €1.67 a month, billed by the hour. Stop Beszel and you only pay for storage.
No. No server, no Docker, no terminal commands. You click start and Beszel runs. Updates are tested on our own instances first and then rolled out.
In your own Beszel instance on servers in Germany and France; bulk storage sits in Frankfurt. Add your own S3 bucket and we back up there daily, encrypted.
Beszel is open source and keeps running on your own server. You fetch the files over a time-limited SFTP access and reach the database with the credentials from the dashboard.